サマリー
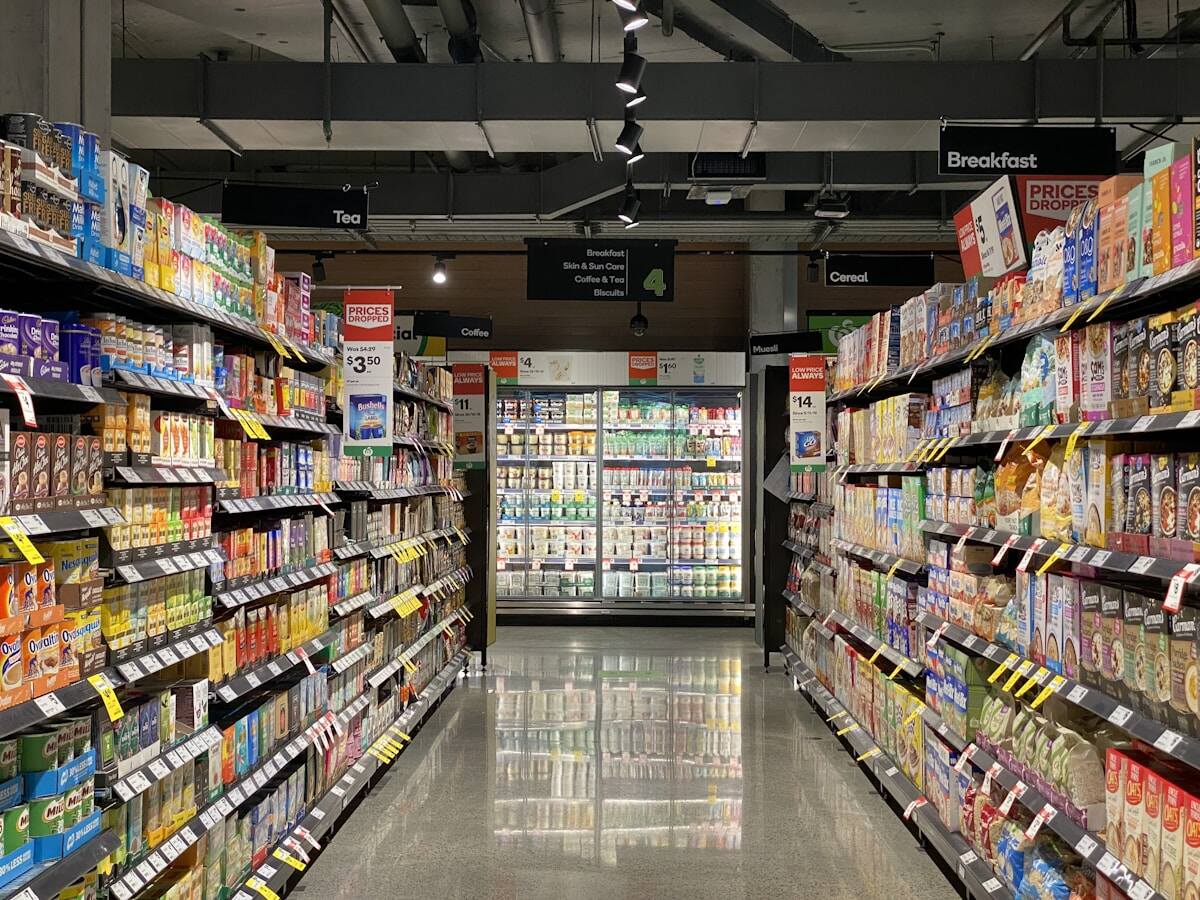
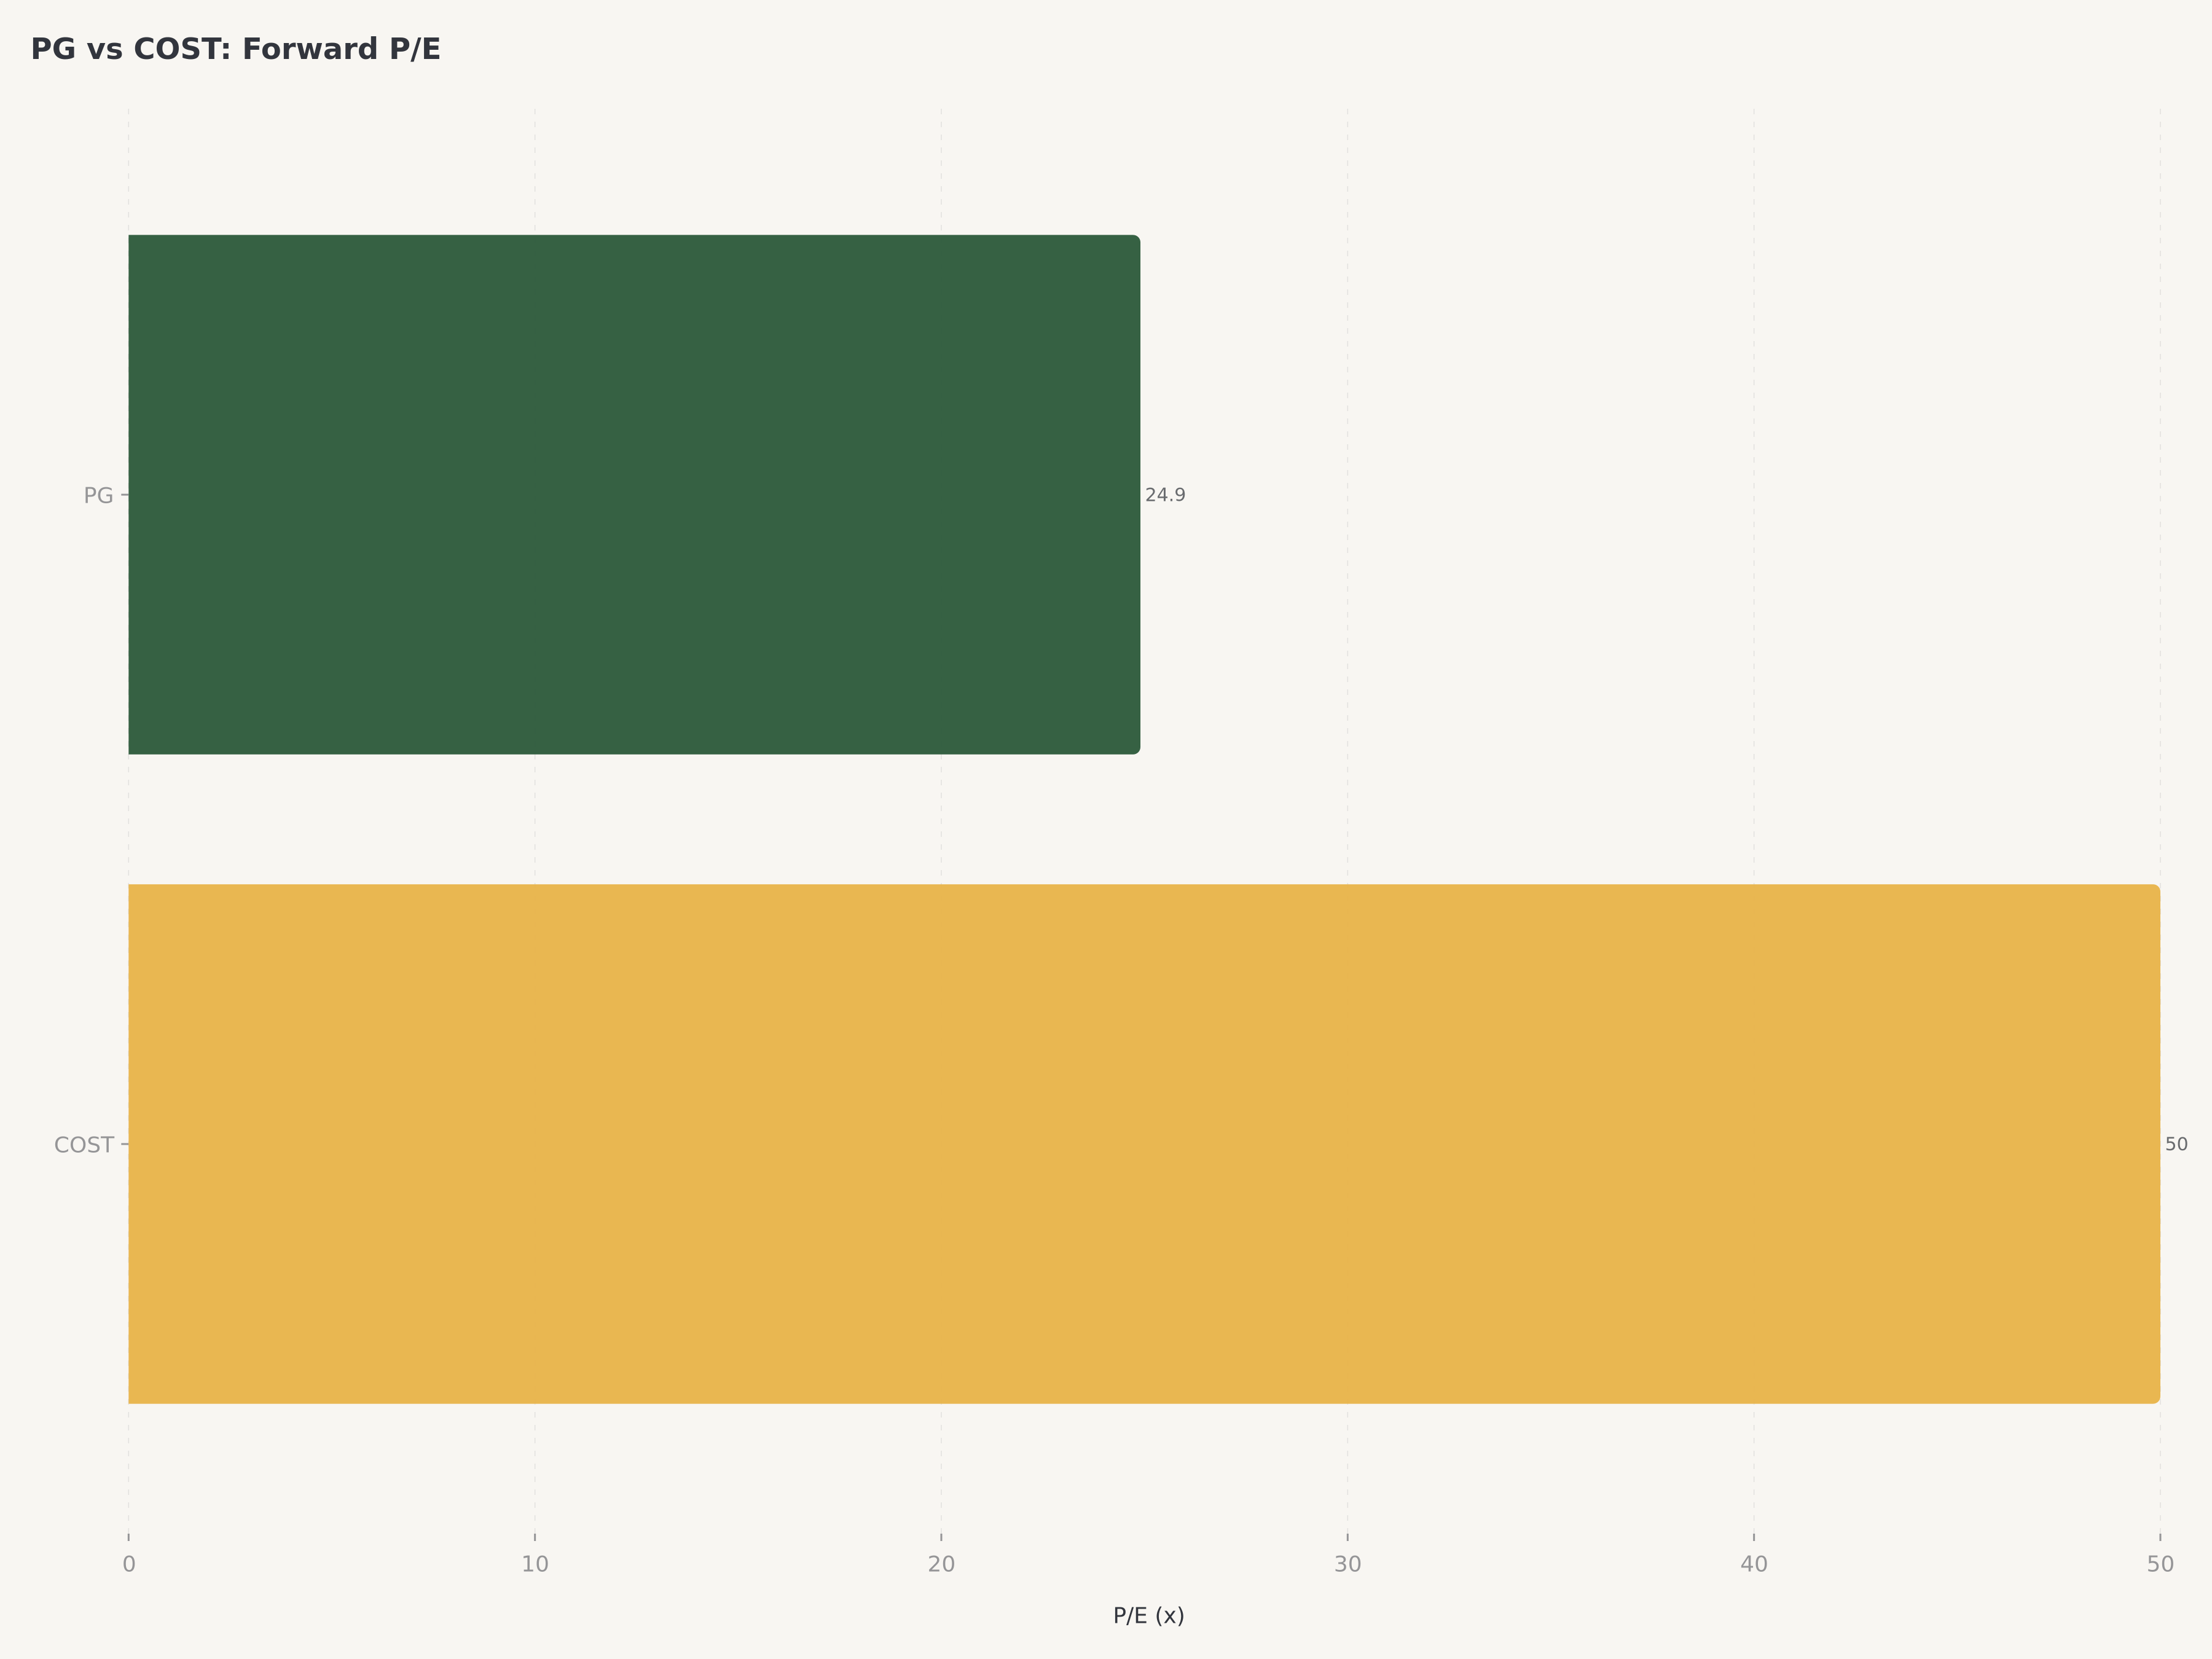
- P&Gとコストコは世界で最も支配的な消費者向け企業の2社だが、全く異なる軸で競争している。PGは世界中のあらゆるチャネルを通じてブランド製品を販売し、COSTはほぼ全ての商品を原価に近い価格で販売し、会員費で収益化している。現在の株価ベースで、PG $165.03(予想PER約24.9倍)はCOST $997(予想PER約50倍)より明らかに優れた投資価値を提供する
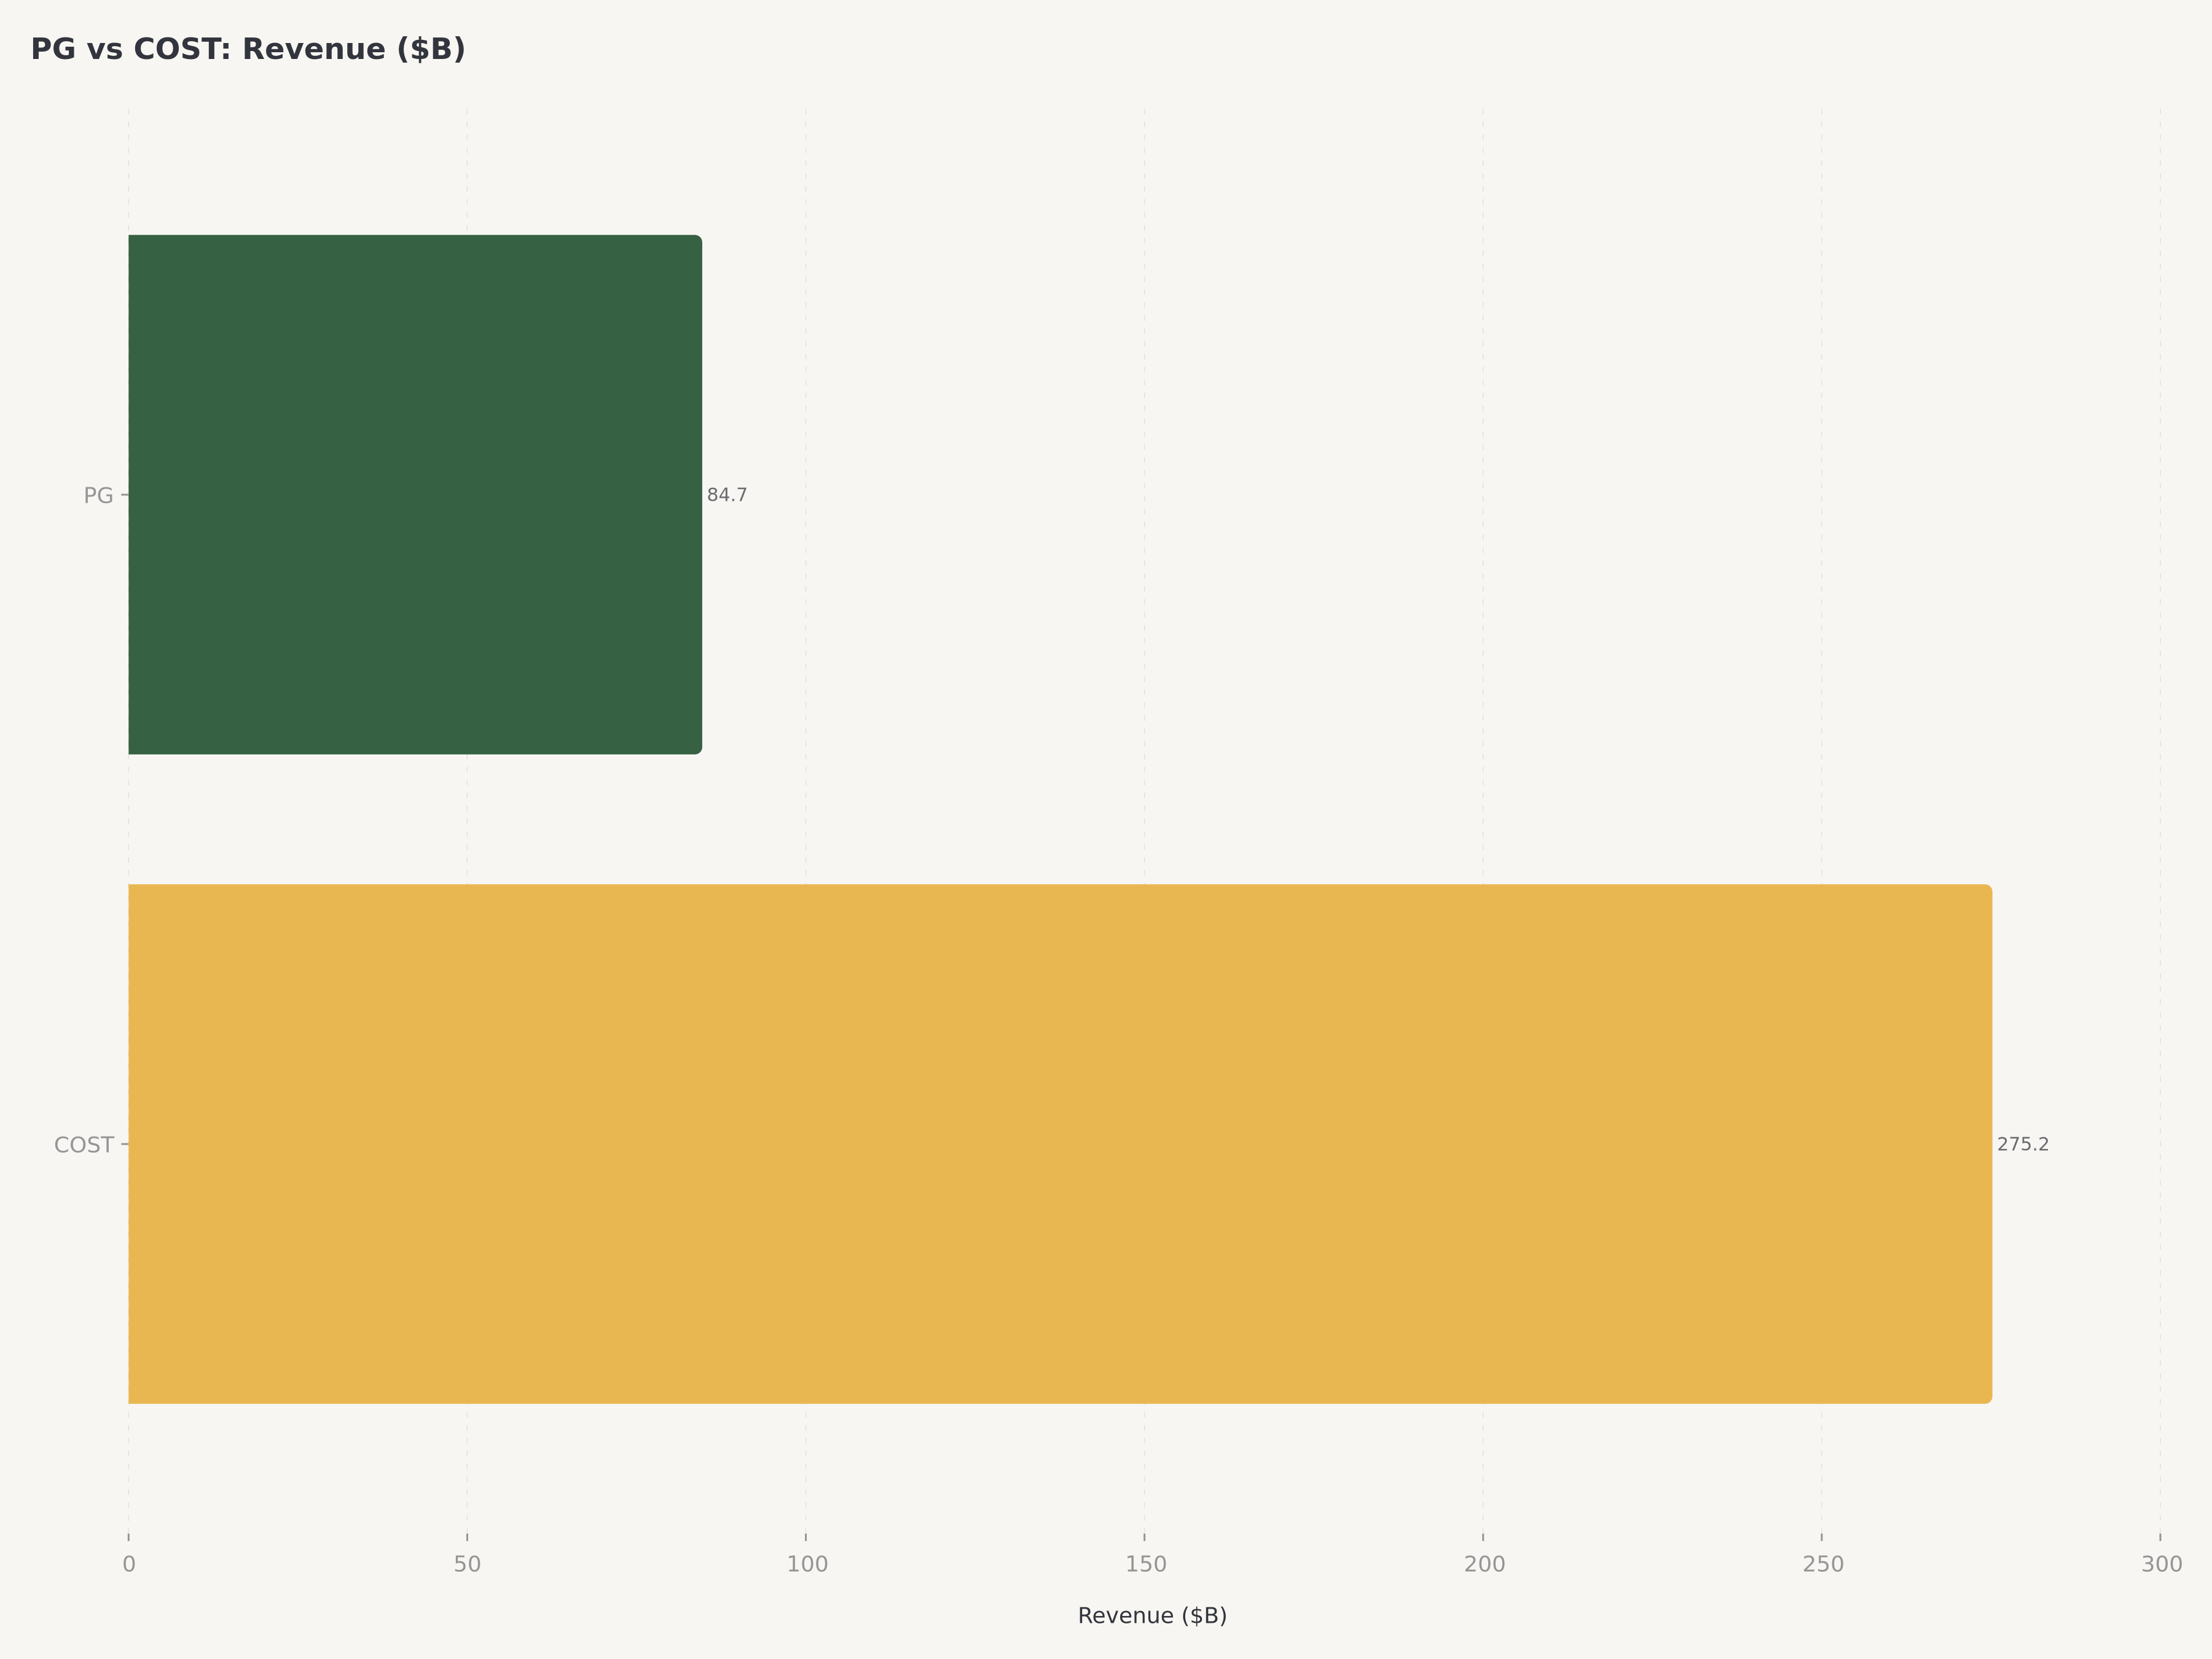
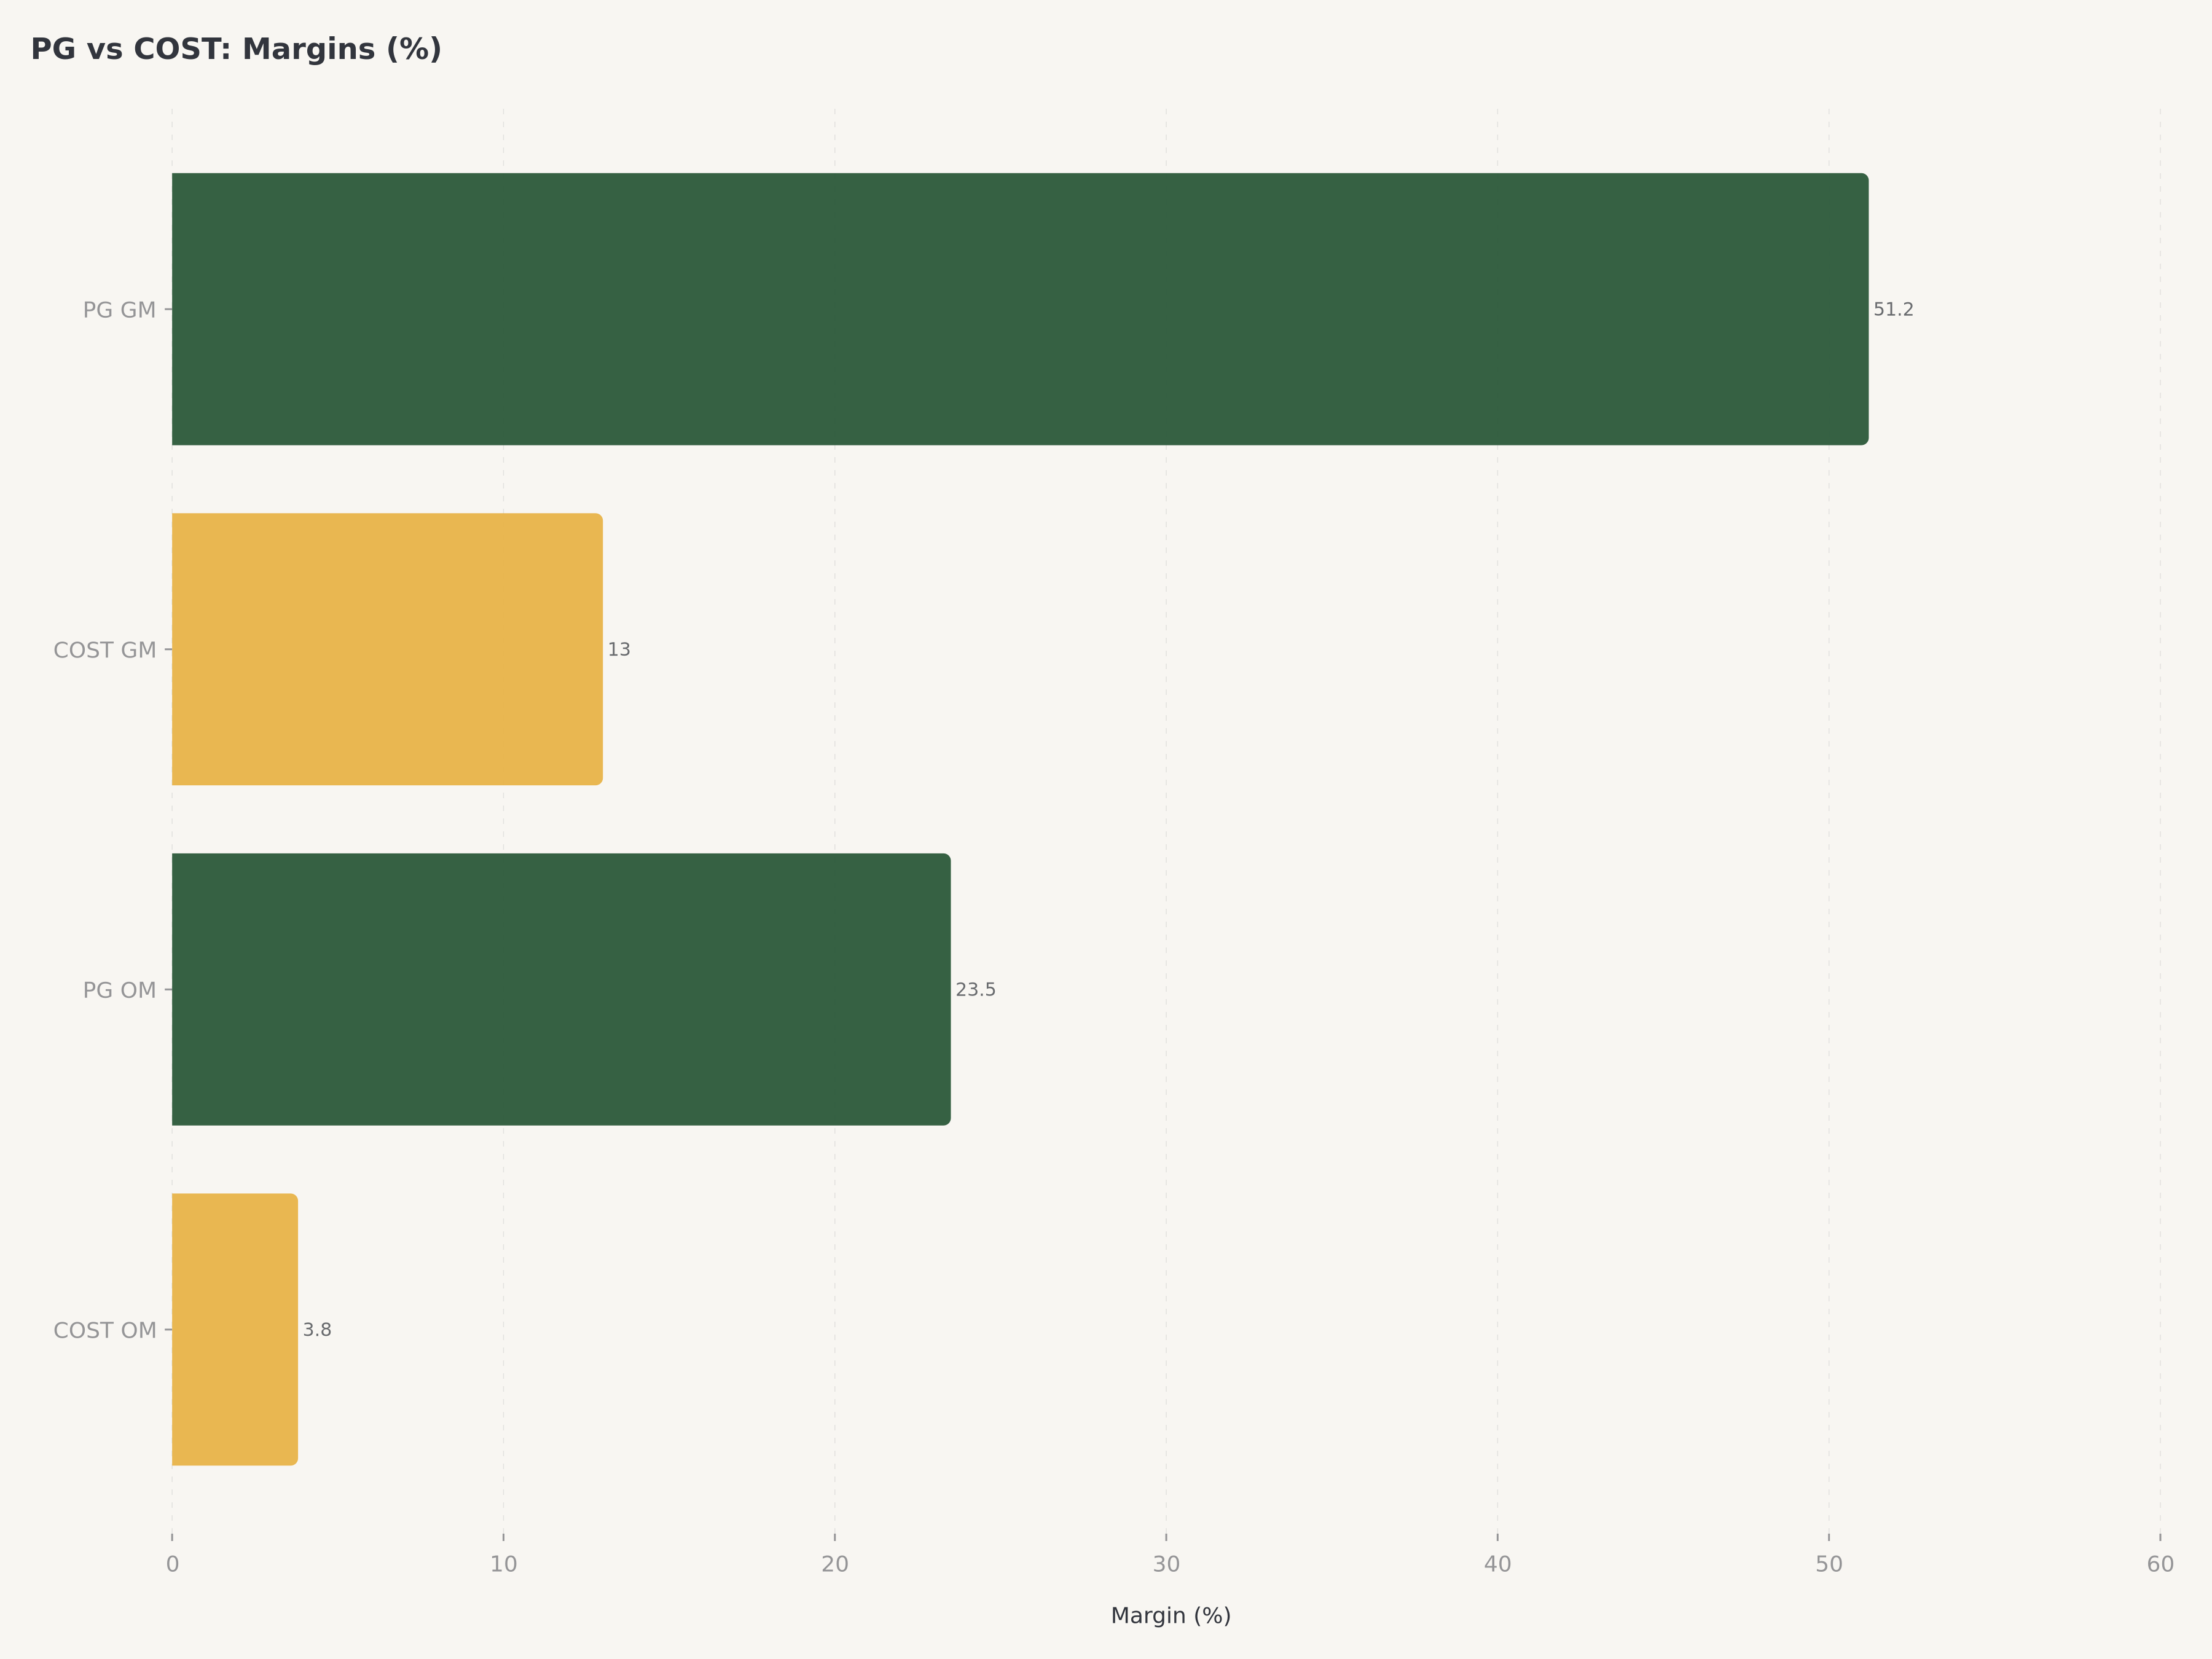
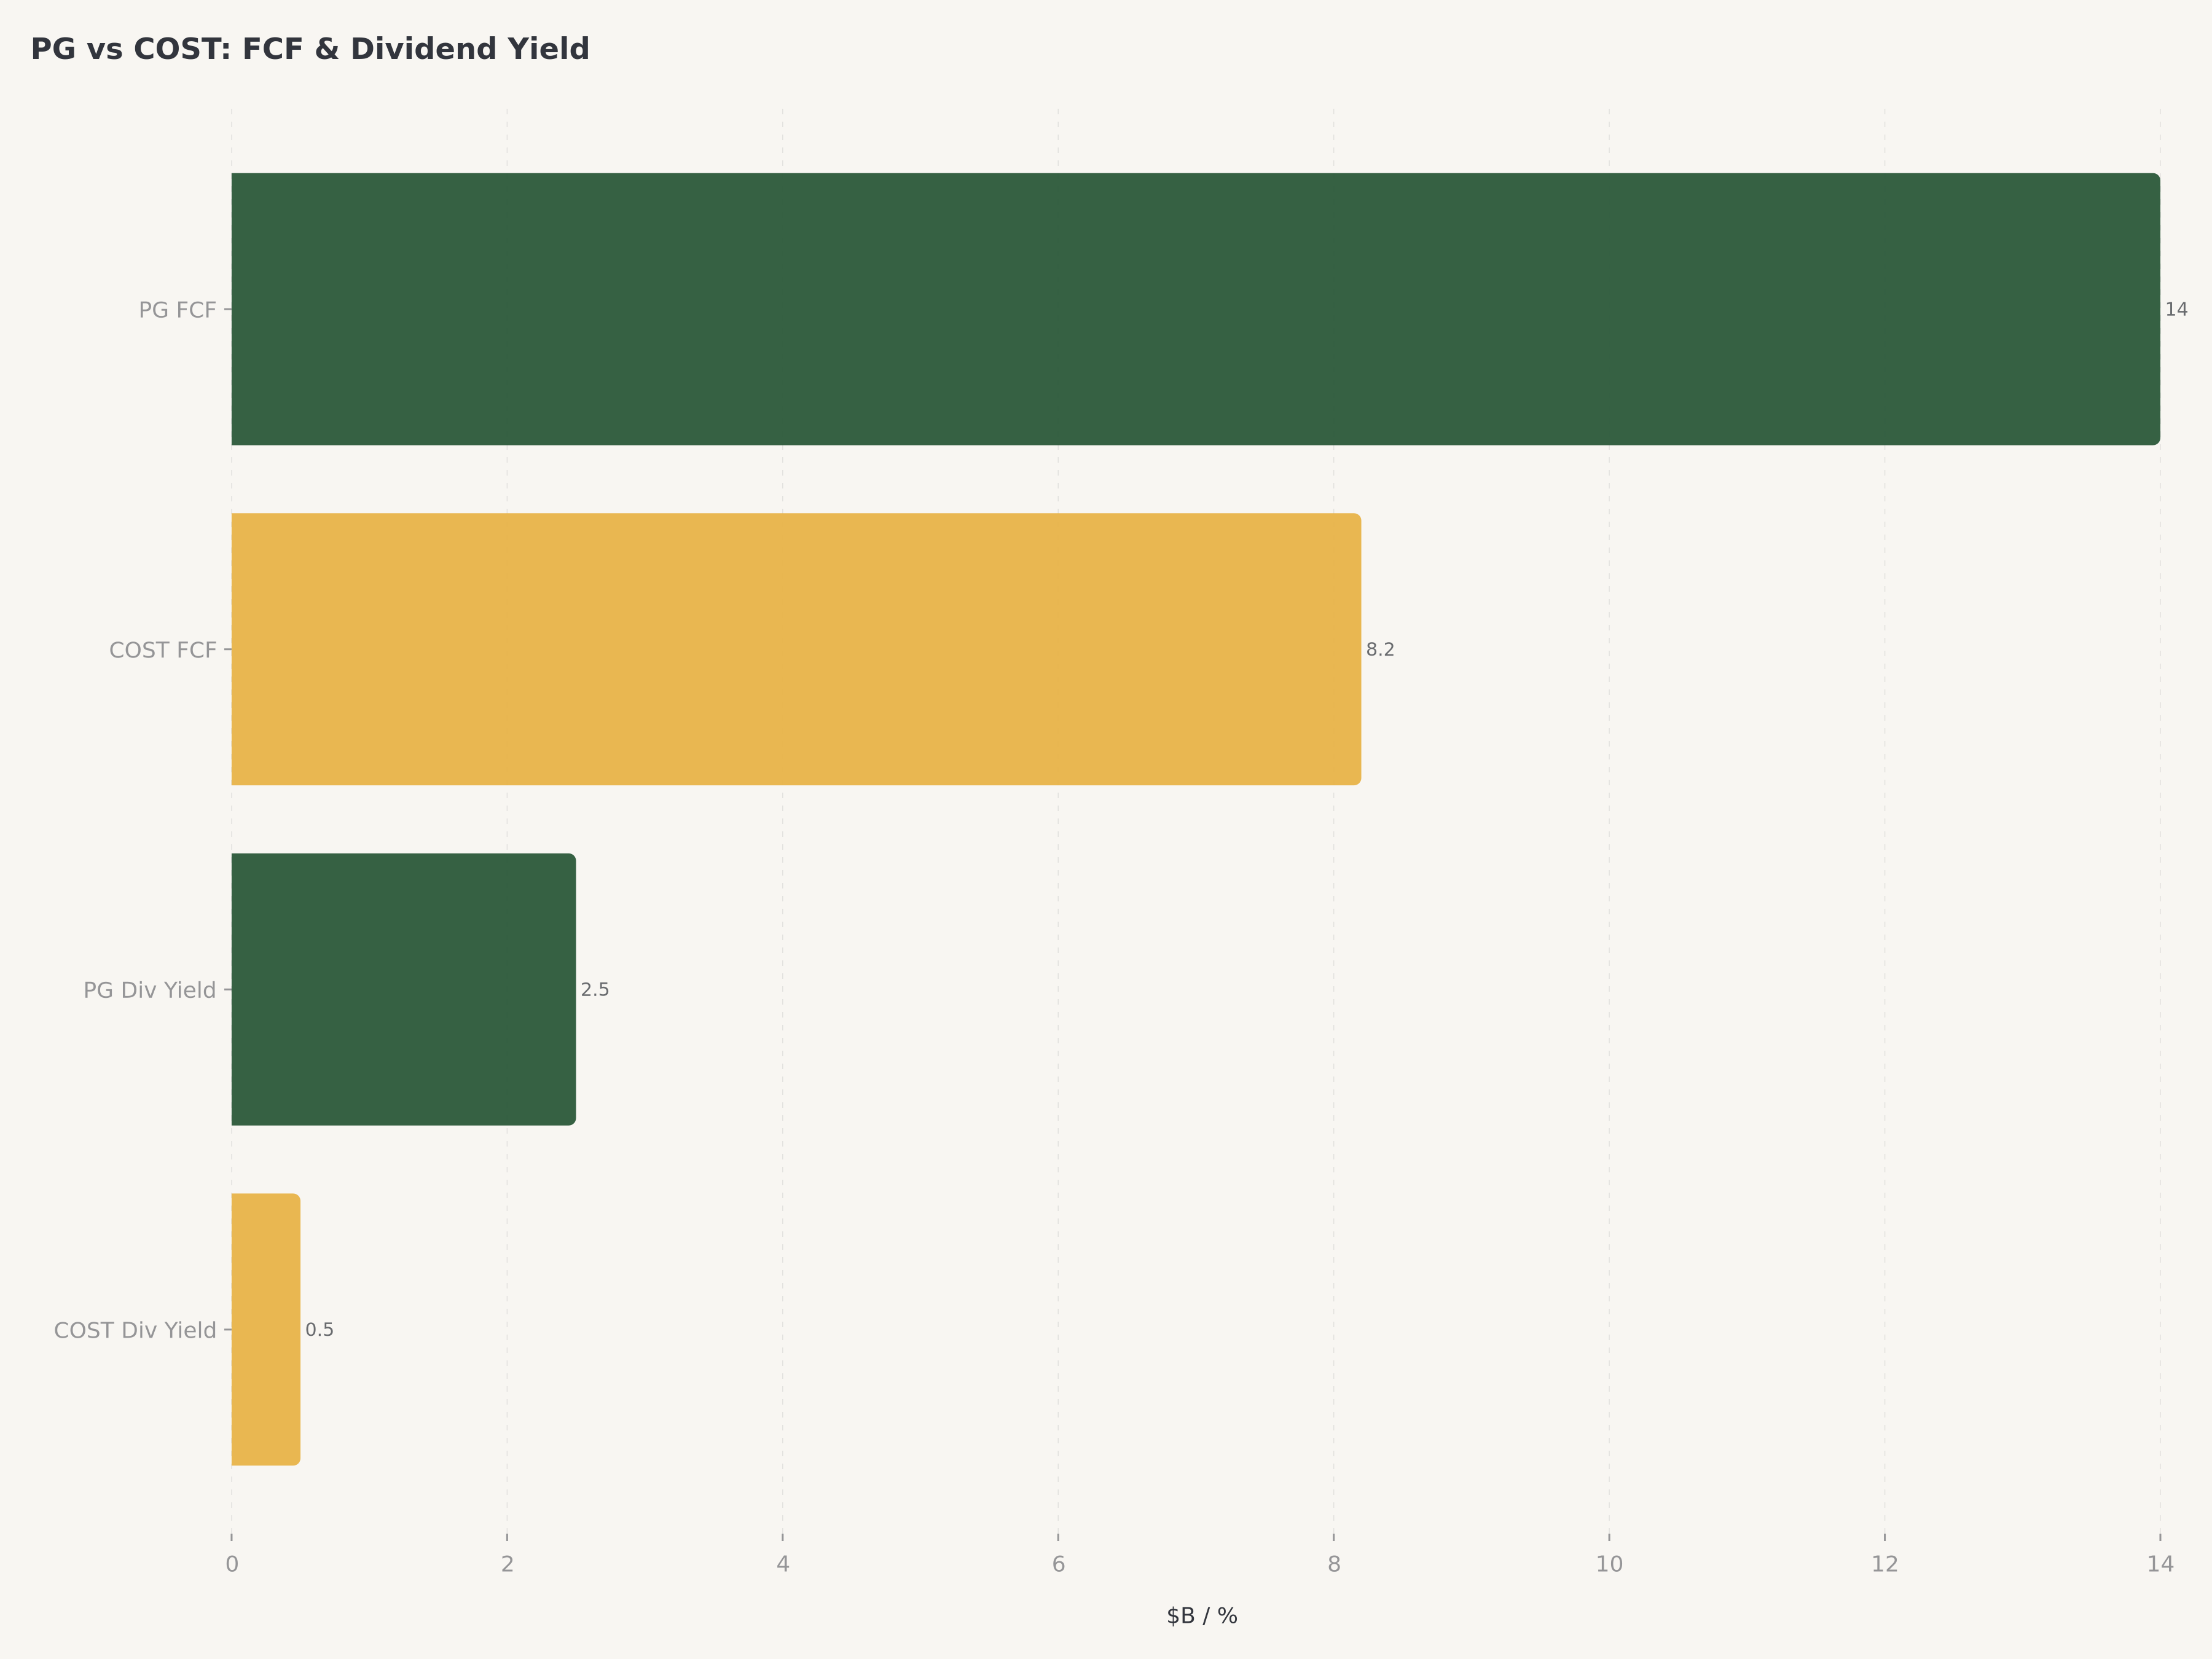
- PGのFY2025売上高約$847億、粗利益率約51.2%は、タイド、パンパース、ジレット、Oral-Bを含む10以上の10億ドル規模市場で1位または2位のシェアを持つブランドポートフォリオの価格決定力を反映している。約$140億のフリーキャッシュフローが68年連続の増配記録(配当王の地位)と約2.5%の配当利回りを支えている
- コストコのFY2025売上高約$2,752億はトップラインでPGの3.2倍の規模だが、約13%の粗利益率と約3.8%の営業利益率は、節約分を会員に還元する意図的な戦略を反映している。真の経済エンジンは93%の更新率を誇る$55億の会員費収入であり、本質的には低マージン小売業者の中に組み込まれた経常的高マージンのサブスクリプション事業である
- PGを買い、COSTを保有と判断する:PGはマージンの安定性、配当収入、フランチャイズ品質に対する妥当なバリュエーションの優れた組み合わせを提供する。COSTは卓越したプレミアムで取引されている卓越した企業である——投資家はより魅力的なエントリーポイントを待つべきだ
2026年の生活必需品セクターの状況
生活必需品セクターは、今日の市場環境において独自の位置を占めている。FRBが引き締めサイクルの最終段階を進む中、インフレが2.5-3%に向けて緩和し、高金利にもかかわらず消費支出が底堅さを示す中、生活必需品企業は価格主導の売上成長が支配した2年間を経て、数量主導の成長への回帰を経験している。この転換は、数量成長が繰り返しの値上げよりも持続可能で政治的感度が低いため重要である。
2つの構造的な力がセクターを再形成している。第一に、プレミアム化トレンドが継続している:あらゆる所得層の消費者がカテゴリー内でグレードアップしている——一般的な洗剤よりタイドパワーポッドを選び、従来のスーパーマーケットブランドよりコストコでオーガニックや特殊製品を選択している。第二に、プライベートブランド(PB)革命が加速しており、コストコのカークランドシグネチャーは現在、米国で売上高ベース最大の消費財ブランドとなり、洗濯洗剤から電池、オリーブオイルに至るカテゴリーでPGのブランドポートフォリオと直接競合している。
これが我々の比較分析の核心に興味深い緊張関係を生み出している。PGは世界最高のブランド消費財企業であり、ブランド価値とイノベーションを通じてマージンを獲得する。コストコは世界最高のバリューリテイラーであり、マージンを圧縮して比類なき価格を提供し、会員ロイヤルティを通じて利益を得る。両モデルとも機能している。問題は、今日の投資家にとってどちらがより魅力的に価格設定されているかである。
隣接セクターの市場リーダーがこの環境にどう対応しているかについての追加的な文脈として、Netflixのストリーミング支配とVisaの決済におけるトールロードモデルの分析を参照されたい——PGやCOSTと同様に、非常に異なる戦略的アプローチで広いモートを構築した企業の事例である。
企業プロファイル:2つの巨人、2つの哲学
P&G(PG)——ブランド帝国
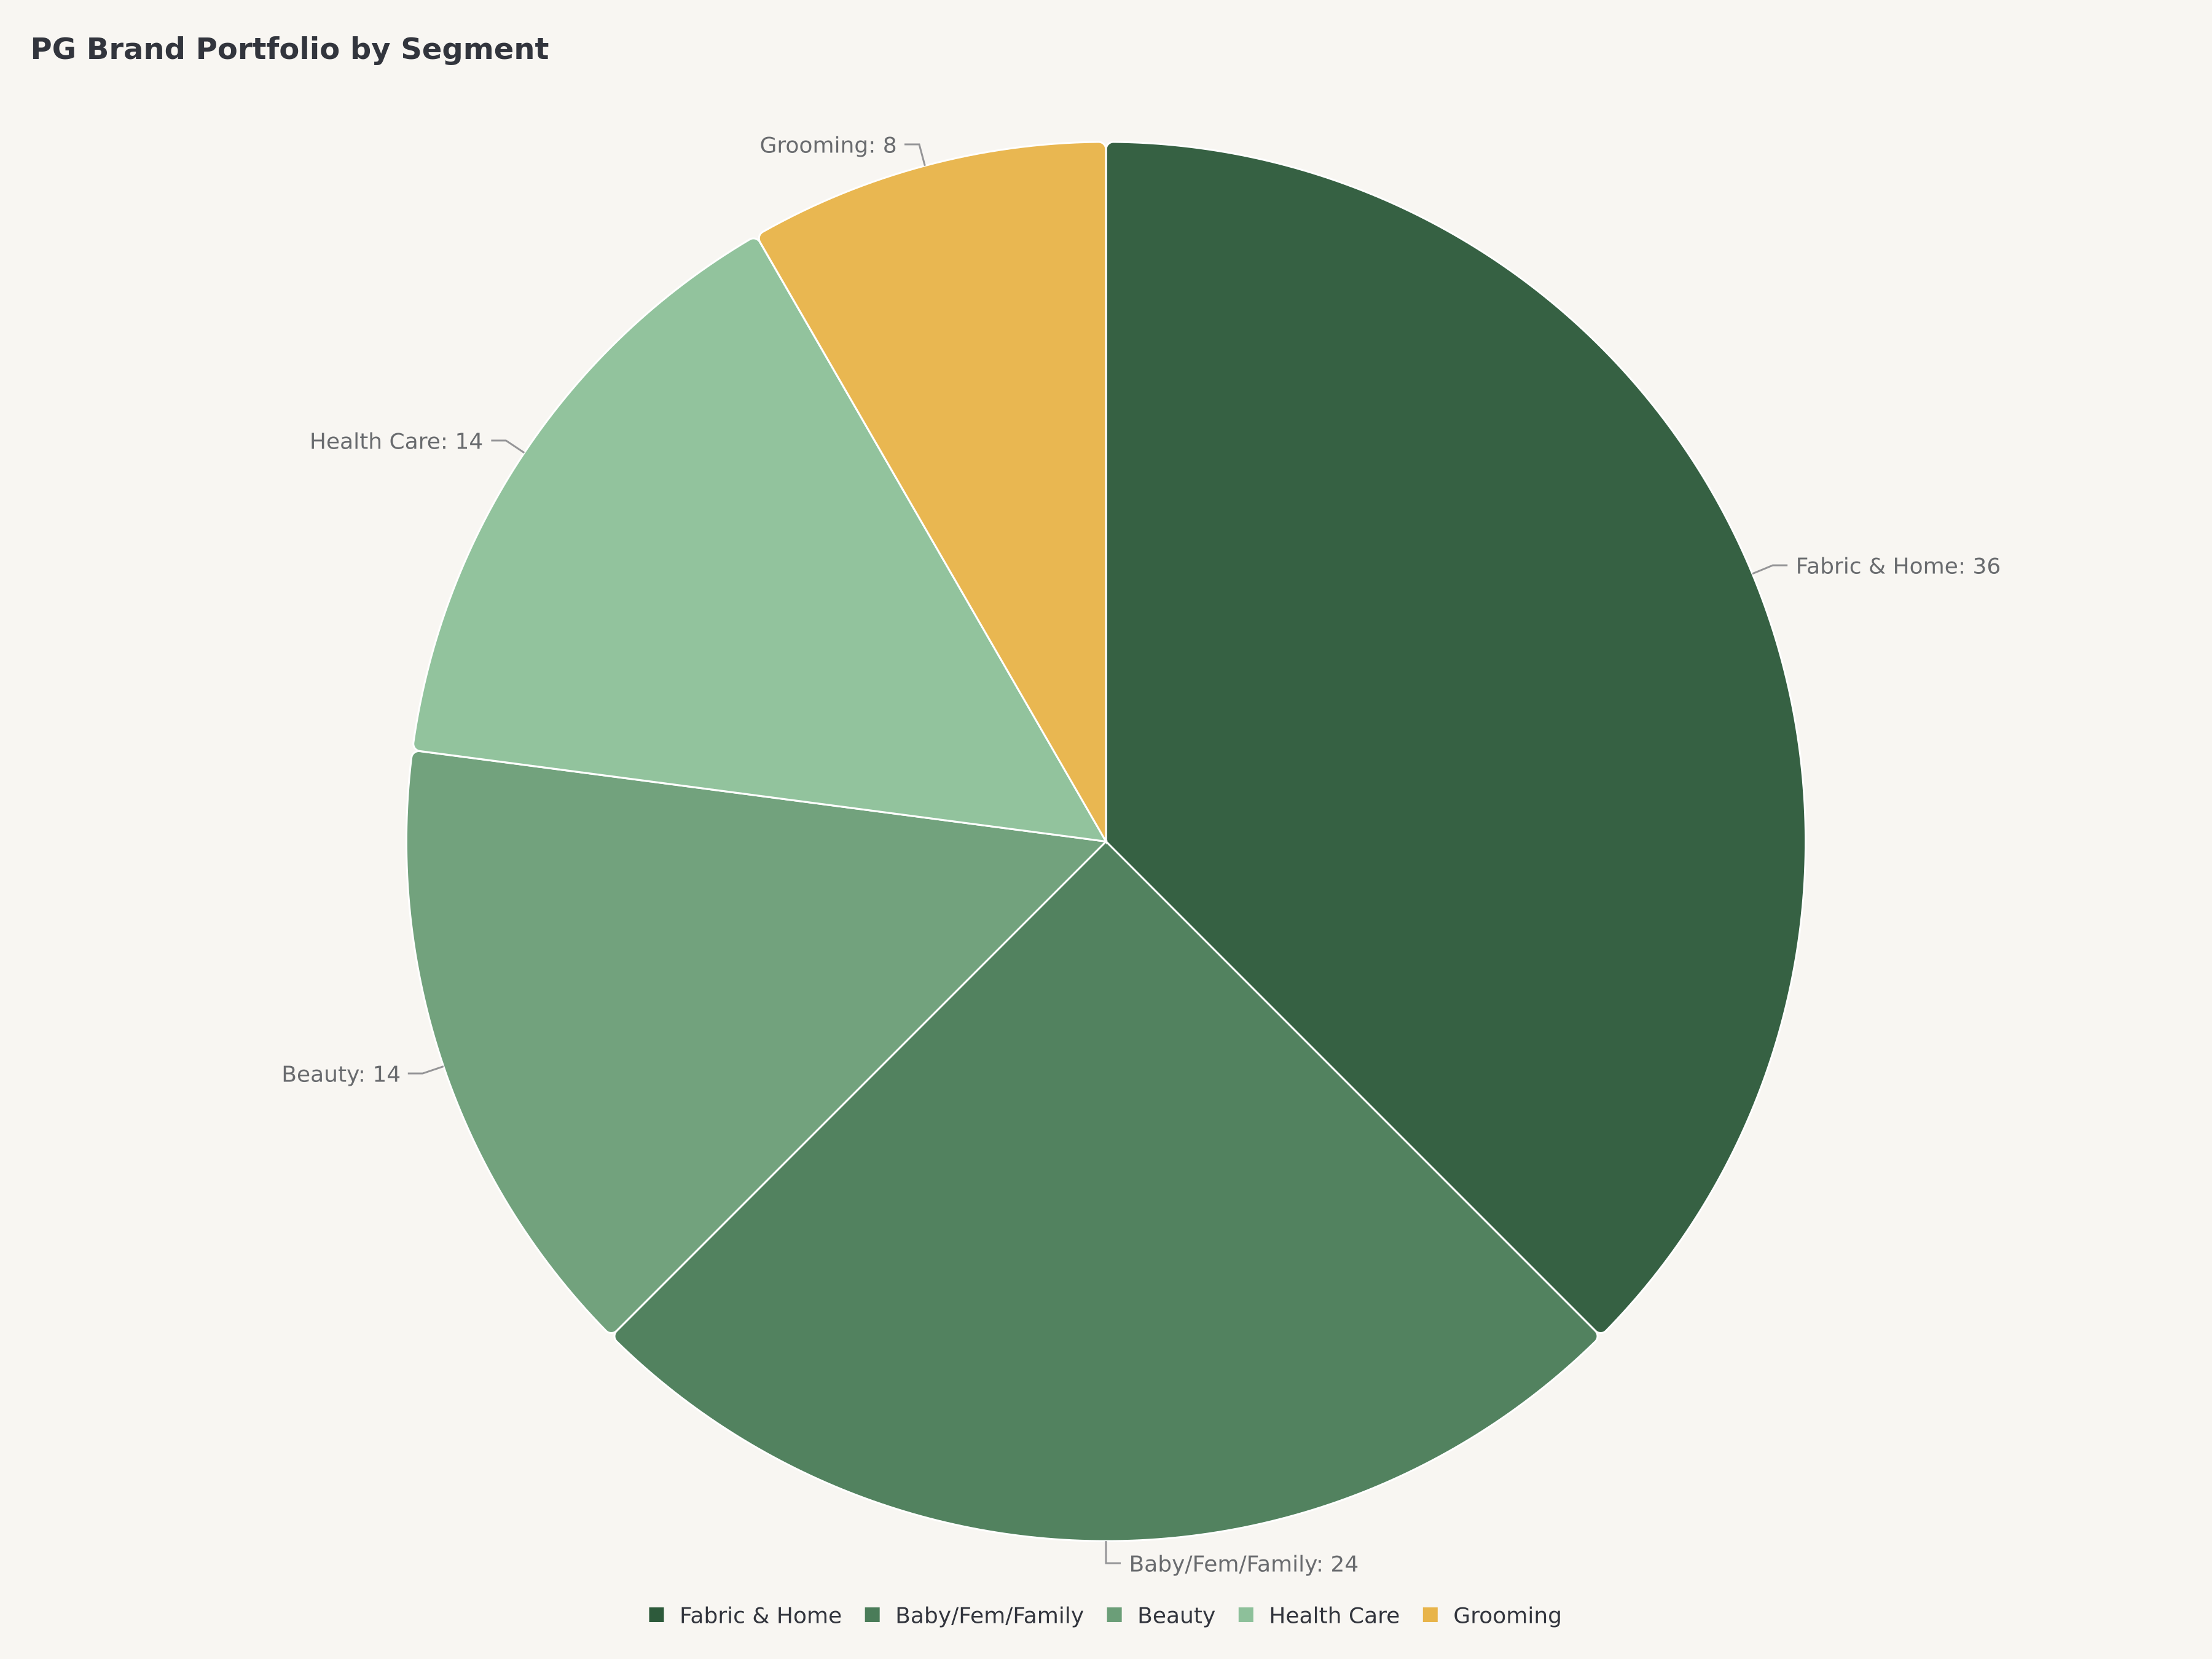
P&Gはオハイオ州シンシナティに本社を置き、CEO Jon Moellerが率いる時価総額ベースで世界最大の消費財企業($3,410億)である。1837年設立のPGは、先進国のほぼ全ての家庭に触れる5つの事業セグメントを通じて事業を展開している:
事業セグメント | 売上比率 | 主要ブランド | 市場ポジション |
ファブリック&ホームケア | 36% | タイド、ダウニー、スウィッファー、ファブリーズ、ドーン | グローバル洗濯1位、ホームケア1位 |
ベビー、フェミニン&ファミリーケア | 24% | パンパース、オールウェイズ、バウンティ、シャーミン | グローバル紙おむつ1位、フェミニンケア1位 |
ビューティー | 14% | SK-II、オレイ、パンテーン、ヘッド&ショルダーズ | グローバルヘアケア1位 |
ヘルスケア | 14% | Oral-B、クレスト、ヴイックス | グローバルオーラルケア1位 |
グルーミング | 8% | ジレット、ブラウン、ヴィーナス | グローバルブレード&カミソリ1位 |
PGの競争優位は3つの柱の上に構築されている。第一に、ブランド価値:PGのトップ10ブランドはそれぞれ年間10億ドル以上の売上を生み出し、ほとんどがグローバルでカテゴリー1位または2位のシェアを保持する。第二に、流通規模:PG製品は1,000万以上の小売拠点を通じて180カ国以上で販売されており、この流通ネットワークは事実上複製不可能である。第三に、R&Dとイノベーション:PGは年間約$20億を研究開発に投じ、プレミアム価格設定を正当化する継続的な製品改善パイプラインを可能にしている。
財務プロファイルはこれらの優位性を反映している。FY2025売上高約$847億、粗利益率約51.2%、GAAP EPS約$6.07、フリーキャッシュフロー約$140億は、緩やかに成長しながらも(オーガニック売上成長は通常3-5%)売上の驚くほど高い割合を現金に変換し、配当と自社株買いを通じて株主に還元するビジネスの定常的な経済モデルを表している。
コストコ(COST)——メンバーシップマシン
コストコはワシントン州イサクアに本社を置き、CEO Ron Vachrisが率いる世界第3位の小売業者(売上高$2,752億)であり、グローバル最大の会員制倉庫型クラブ運営者である。時価総額$4,421億のコストコは、米国、カナダ、メキシコ、日本、英国、韓国、オーストラリア、台湾、その他の市場で897店舗を運営している。
コストコのビジネスモデルは意図的に反直感的である。同社は小売事業をほぼ損益分岐点のマージンで運営している——粗利益率約13%、営業利益率約3.8%——戦略的目標が製品販売からの利益ではないためだ。代わりにコストコの経済エンジンは、FY2025に93%の更新率で$55億の手数料を生み出した会員プログラムである。この構造は小売業で最も防御的なビジネスモデルの1つを生み出している:
指標 | 詳細 |
店舗数 | 世界897店舗 |
会員費収入 | $55億(FY2025) |
会員更新率 | 93% |
カークランドシグネチャー売上高 | 約$700億(推定) |
平均取引単価 | 約$110 |
EC成長率 | 前年比+22% |
SKU数 | 約3,700(一般的なスーパーの約30,000対比) |
このモデルの真髄はフィードバックループにある。低価格が会員加入を促進する。会員費が運営を支える。運営効率がより低い価格を可能にする。より低い価格がより高い更新率を促進する。93%の更新率は、コストコの会員費収入基盤がSaaSサブスクリプション事業とほぼ同等に予測可能であることを意味し——しかも売上原価がゼロである。
コストコのEC事業は前年比+22%で成長しており、新規店舗開設以外の主要な成長ベクトルである。総売上高に占める割合はまだ小さいが、デジタルチャネルはコストコのリーチを倉庫型フォーマットに合わない商品(家具、家電、高級品)に拡大し、将来的に店舗顧客になり得る若い会員を獲得している。
財務比較:数字で見る両社の対比
売上高と規模
指標 | PG(FY2025) | COST(FY2025) | 優位 |
売上高 | 約$847億 | 約$2,752億 | COST(3.2倍) |
売上高成長率(YoY) | 約3%オーガニック | 約7% | COST |
海外売上比率 | 約55% | 約28% | PG(より多角化) |
EC成長率 | 約8% | 約22% | COST |
展開国数 | 180+ | 14 | PG |
コストコのトップライン規模は大幅に大きいが、この比較はやや誤解を招く。PGはブランドメーカーレベルで売上を計上し(小売業者への販売)、コストコは小売レベルで売上を計上する(消費者への販売)。コストコで販売されるクレストの歯磨き粉1本は両社の売上を生み出す——PGに約$2、コストコの消費者販売価格約$6。PGの売上はブランド製造の粗利益率抽出を反映し、コストコの売上は最小マークアップでの小売通過量を反映している。
マージンと収益性
指標 | PG(FY2025) | COST(FY2025) | 優位 |
粗利益率 | 約51.2% | 約13% | PG(設計上) |
営業利益率 | 約23% | 約3.8% | PG(設計上) |
純利益率 | 約18% | 約2.8% | PG |
GAAP EPS | 約$6.07 | 約$17.16 | ——(発行株数が異なる) |
ROE | 約30% | 約28% | ほぼ同等 |
マージン格差は巨大だが、完全に設計上のものである。PGの51%粗利益率は、消費者がジェネリック洗剤に対してタイドブランドに支払うブランドプレミアムを反映している。コストコの13%粗利益率は、ブランド商品のマークアップを14-15%、カークランド製品を15-20%に意図的に制限する決定を反映している。どちらのマージン構造が「優れている」わけではない——根本的に異なるビジネスモデルを反映しているのだ。重要なのは、両社が同等のROE(約28-30%)を生み出していることで、これは両モデルが株主資本をリターンに変換する効率は同等であり、経路が異なるだけであることを意味する。
フリーキャッシュフローと株主還元
指標 | PG(FY2025) | COST(FY2025) | 優位 |
フリーキャッシュフロー | 約$140億 | 約$70億 | PG(2倍) |
FCFマージン | 約16.5% | 約2.5% | PG |
配当利回り | 約2.5% | 約0.5% | PG |
連続増配年数 | 68年 | 21年 | PG(配当王) |
年間自社株買い | 約$70-80億 | 約$10-20億 | PG |
5年トータルリターン | 約45% | 約180% | COST |
これがポートフォリオ構築に最も関連する比較項目である。PGはキャッシュ生成マシンだ——$847億の売上から$140億をフリーキャッシュフローに変換する16.5%のFCFマージンは生活必需品セクターで最高水準の1つである。この現金は68年連続増加の配当(世界で一握りの企業のみが持つ配当王の地位)と、年間約1-2%の発行株数削減のための自社株買いを支えている。
コストコの$70億FCFは$2,752億売上の2.5%(FCFマージン)で、極めて薄いマージンモデルを反映している。しかし、コストコの5年トータルリターンはPGを大幅に上回った(約180% vs 約45%)。投資家が会員費収入のサブスクリプション的品質を認識し、市場がコストコのマルチプルを一貫して上方修正してきたためである。問題は、予想PER 50倍でこの再評価がさらに進む余地があるかどうかだ。
バリュエーション比較:バリュー vs グロースプレミアム
バリュエーション指標 | PG | COST | S&P 500平均 |
予想PER | 約24.9倍 | 約50倍 | 約20倍 |
株価/FCF | 約24倍 | 約63倍 | 約22倍 |
EV/EBITDA | 約18倍 | 約35倍 | 約14倍 |
PSR | 約4.0倍 | 約1.6倍 | 約2.8倍 |
配当利回り | 約2.5% | 約0.5% | 約1.3% |
PEG比率 | 約3.5倍 | 約4.5倍 | 約1.8倍 |
PGはS&P 500平均に対して意味のあるプレミアムで取引されているが、全ての利益ベースの指標でコストコに対して大幅なディスカウントで取引されている。予想PER 25倍のスプレッドは過去10年で最も広い——歴史的にコストコはPGに対して40-60%のプレミアムで取引されていたが、現在は100%のプレミアムである。
PGのバリュエーション論拠: 約24.9倍の予想PERで、PGはその本質に見合った価格設定がされている——低成長、高品質のコンパウンダーとして。3-5%のオーガニック売上成長、生産性プログラムによるマージン拡大、自社株買いからの2-3%が組み合わさり、高い一桁台のEPS成長を構成する。2.5%の配当利回りは現在の収入を提供する。51%の粗利益率を持つ配当王に対して、合理的だが過度ではないバリュエーションである。
COSTのバリュエーション論拠: 約50倍の予想PERで、コストコは一桁台の売上成長にもかかわらず成長株として価格設定されている。プレミアムは3つの要因を反映している:(1)メンバーシップモデルの経常的収入特性、(2)継続的な倉庫拡張の期待(年間20-25店舗の新規開設)、(3)EC成長の余地。しかし、50倍の予想PERはマルチプルの継続的拡大または成長の大幅な加速を要求し——いずれも保証されていない。コストコのPERが40倍に圧縮された場合(それでも歴史的平均を上回る)、利益が横ばいでも株価は約20%下落する。
バリュエーション格差が我々の投資テーゼの核心である。PGはワールドクラスのフランチャイズに対して合理的な価値を提供する。COSTは投機的バリュエーションで取引されているワールドクラスのフランチャイズである。
リスク比較:異なるエクスポージャー、異なる懸念
PGリスク
リスク要因 | 深刻度 | 発生確率 | 影響 |
PB競合(カークランド、Amazon Basics) | 中程度 | 高 | 特定カテゴリーのマージン/シェアの漸進的侵食 |
為替逆風(55%海外売上) | 中程度 | 中程度 | ドル高年にEPS 2-3%の下押し |
投入コストインフレ(コモディティ、輸送) | 中程度 | 中程度 | 一時的なマージン圧縮 |
成熟カテゴリーの数量停滞 | 中-低 | 中程度 | オーガニック成長の上限を制限 |
パッケージングに関する規制/ESG圧力 | 低 | 低 | 長期的なコスト逆風 |
PGのリスクプロファイルは、ゆっくりと進行する予測可能な脅威が特徴である。PB浸透が最も重要な長期リスクだ——カークランドシグネチャーだけで洗濯洗剤、ペーパータオル、紙おむつ、パーソナルケアでPGと直接競合している。しかしPGは、イノベーション(タイドパワーポッド、オールウェイズディスクリート)とプレミアム化(SK-II、オレイリジェニスト)を通じてカテゴリーリーダーシップを防衛する能力を実証してきた。地理的多角化(55%海外売上)は為替リスクを生むが、単一経済への依存度も低減している。
COSTリスク
リスク要因 | 深刻度 | 発生確率 | 影響 |
バリュエーション圧縮(PER平均回帰) | 高 | 中程度 | 20-30%の下落の可能性 |
会員費値上げへの反発 | 中程度 | 低 | 加入成長の鈍化の可能性 |
米国コア市場の店舗飽和 | 中程度 | 中程度 | 店舗拡張軌道の鈍化 |
EC競争(Amazon、Walmart+) | 中程度 | 中程度 | 非店舗チャネルへの脅威 |
賃金インフレによるマージン圧力 | 中-低 | 中程度 | すでに薄いマージンの追加圧縮 |
コストコの主要リスクはバリュエーションベースであり、オペレーションベースではない。ビジネス自体は驚くほどレジリエントだ——93%の会員更新率は景気後退、パンデミック、インフレ環境を通じて安定的に維持されてきた。リスクは、予想PER 50倍において、成長、会員トレンド、またはマクロ環境の期待外れが急激なマルチプル圧縮を引き起こし得ることだ。40倍の予想PERへの回帰(依然として同業他社に対するプレミアム)だけでも現在の水準から約20%の下落を示唆する。また、コストコの897店舗は国際的に相当の拡張余地を残しているが、売上の約72%を占める米国市場は主要都市圏で飽和に近づいている。
リスク総合評価
PGのリスクは緩やかで漸進的であり、オペレーション上の実行で概ね管理可能である。COSTのリスクはバリュエーションに集中している——ビジネスはほぼ完璧だが、株価は持続的な完璧なパフォーマンスを前提としている。リスク回避志向の投資家にとって、PGはより予測可能な保有体験を提供する。
結論:PG 買い、COST 保有
P&G(PG)——買い。 $165.03で予想PER約24.9倍のPGは、品質、収入、合理的バリュエーションの稀有な組み合わせを提供する。51%の粗利益率は持続的なブランド価格決定力を反映している。年間$140億のフリーキャッシュフローは、13人の大統領、8回の景気後退、2回のグローバルパンデミックを跨いだ68年連続増配記録を持つ2.5%の配当利回りを支えている。3-5%のオーガニック成長、生産性プログラムによるマージン拡大、継続的な自社株買いは、高い一桁台の年間EPS成長への明確なパスを提供する。PGは刺激のために買う銘柄ではない。複利成長のために買う銘柄であり——現在の価格で複利の数学は成り立つ。
コストコ(COST)——保有。 $997で予想PER約50倍のコストコは、世界最高のビジネスの1つであると同時に、消費者小売で最も要求の厳しいバリュエーションの1つに位置している。メンバーシップモデル(93%更新率、$55億の高マージン会費)は真に差別化されており、サブスクリプション品質の予測可能性に近づいている。+22%のEC成長と国際展開は正当な成長ベクトルを提供する。しかし現在のバリュエーションは、エラーの余地が最小限の期待を織り込んでいる。予想PER 50倍では、投資家は実現に3-5年かかる可能性のある成長に対して今日支払っている。$850以下(約42倍の予想PER)ではリスク/リワードが大幅に改善するため、より建設的なスタンスに転じる。既存保有者にとって、ビジネス品質はポジション維持を正当化する。新規資金にとって、エントリーポイントは最適ではない。
なぜ今PGがCOSTより優れているか: 判断は品質1ドルあたりの支払い価格に帰結する。両社とも卓越したフランチャイズである。しかし、約25倍PER、2.5%配当利回り、配当王の地位を持つPGは、約50倍PER、0.5%配当利回りのCOSTよりも優れたリスク調整後リターンプロファイルを提供する。PGの低いマルチプルは、金利上昇やリスクオフ環境でのバリュエーションリスクが小さいことを意味する。PGの高い配当利回りは、待っている間に報酬を得られることを意味する。PGのより強力なFCF創出力($140億 vs $70億)は、株主還元、買収、または再投資のためのより大きな柔軟性を提供する。
FAQ
P&Gは2026年に良い配当株か?
はい。PGは68年連続で配当を増加させた世界最高の配当銘柄の1つであり——配当王(配当継続性の最高ランク)に該当する。現在の約2.5%の配当利回りは年間約$140億のフリーキャッシュフローに裏付けられており、PGの配当性向は約60%で、今後の継続的な増配のための十分な余裕がある。インカム重視のポートフォリオにとって、PGは少数の消費財同業他社しか比較できない利回り、成長性、安全性の組み合わせを提供する。
なぜコストコのPERはP&Gよりはるかに高いのか?
コストコのプレミアムバリュエーション(約50倍予想PER vs PGの約25倍)は、市場が3つの要因を評価していることを反映している:(1)メンバーシップモデルが93%の更新率で経常的高マージン収入を生成し、投資家がSaaSサブスクリプションと同様に評価している;(2)コストコは新規店舗開設(年間20-25店舗)と国際展開を通じてより長い成長滑走路を持つ;(3)ECチャネルが年間+22%で成長している。しかし、PER 50倍ではこの成長の大部分がすでに織り込まれており、短期的な上値を制限しバリュエーションリスクを生み出している。
コストコのカークランドシグネチャーはPGブランドとどう競合するか?
カークランドシグネチャーはコストコのPBブランドで、年間売上高は推定約$700億に上り、売上高ベースで米国最大の消費財ブランドとなっている——PGのどの個別ブランドよりも大きい。カークランドは洗濯洗剤、ペーパータオル、紙おむつ、電池、パーソナルケアでPGと直接競合している。しかし、競合関係は微妙である:PG製品もコストコで最も売れている商品の1つであり、多くのカークランド製品は実際には大手消費財企業(時にはPGの子会社を含む)が製造している。両者の関係は競争的であると同時に共生的でもある。
どちらの銘柄が景気後退に強いか?
PGとCOSTの両社とも歴史的に強い景気後退耐性を示してきたが、異なるメカニズムを通じてである。PGは経済状況に関係なく消費者が購入する家庭必需品(洗剤、紙おむつ、歯磨き粉)の販売から恩恵を受け、55%の海外売上が地理的多角化を提供する。コストコは価値提案から恩恵を受ける——景気後退時にはより多くの消費者が予算を節約するために倉庫型クラブでの買い物に切り替え、会員更新率は深刻な景気後退時でも歴史的に90%以上を維持してきた。2008-2009年の景気後退では、PGはピークからボトムまで約25%下落し、COSTは約30%下落した。これはPGの低い出発バリュエーションを反映している。COSTの現在のPER 50倍を考慮すると、マルチプル圧縮リスクが低いためPGが景気後退シナリオで再び優れたパフォーマンスを示すと考える。
我々の投資判断を変えるものは何か?
以下の場合にCOSTを買いに格上げする:(1)株価が$850以下(約42倍予想PER)に調整され、より魅力的なリスク/リワードを提供する場合;(2)会員成長が現在のトレンドを超えて加速し、より高い成長率が検証される場合;(3)EC売上が総売上の10%以上に拡大し、ユニットエコノミクスが改善する場合。以下の場合にPGを保有に格下げする:(1)PB浸透が複数のコアカテゴリーで大幅に加速する場合;(2)オーガニック売上成長が複数四半期連続で2%を下回る場合;(3)対応する利益成長なしに株価が$200以上に上昇し、予想PERが30倍を超える場合。
免責事項:本記事は情報提供のみを目的としており、投資助言を構成するものではありません。著者およびEdgenは、議論された証券のポジションを保有していません。過去のパフォーマンスは将来の結果を示すものではありません。投資家は投資判断を行う前に独自のデューデリジェンスを実施すべきです。

投資、もうひとりじゃない
Ed を無料で試そう。クレカ不要、縛りなし